Green Data by Consist – Your key to energy and cost management
In the interaction between the EU Taxonomy Regulation and the Corporate Sustainability Reporting Directive (CSRD), companies will in future have to report on how sustainable their business activities are.
In view of rising energy and CO2 costs, companies have the opportunity to use data not only for reporting, but also to specifically optimize their consumption.
In order to maintain an overview and manage this as efficiently as possible from the company's point of view, it helps to have a data management that includes all relevant data with regard to energy costs, energy efficiency and CO2 footprint.


With a Europe-wide unique expertise in Big Data, we are committed to efficient digital processes that
» reduce energy consumption,
» reduce the CO2 footprint
» and optimise costs.
Our Sustainability Services at a glance
-
Reduce Energy Costs
savings potential for buildings, data centers and production.
Sustainability Toolkit -
EU-CSRD-Reporting
Planning and configuring the data pipeline for your EU CSRD reporting
End to End Data Management -
Full support by our highly qualified team
Take advantage of our know-how from requirements gathering up to implementation.
Schedule a Demo
Reduce energy costs and CO2 – based on a unified data management solution
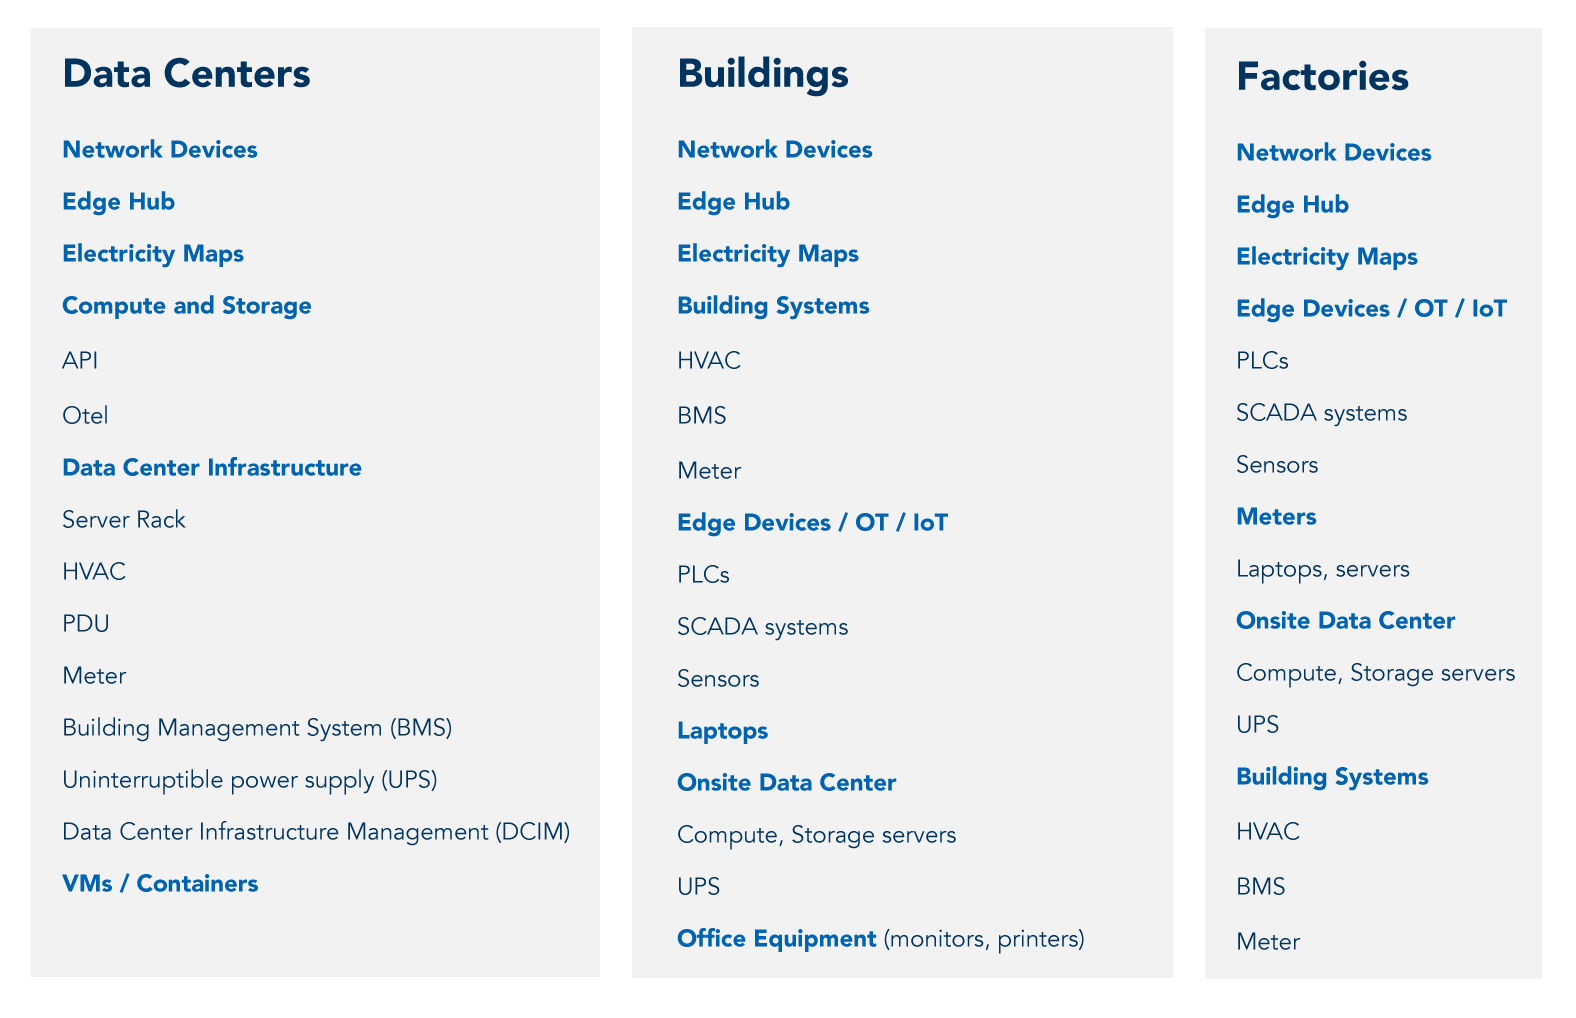
Buildings, data centers and production facilities are the main cost drivers for energy. In order to realize relevant savings potential, it is important to record their data.
Because you can't manage what you can't measure.
Data can be found in the most diverse places in the company, in the most diverse formats. A central data solution provides a complete, structured insight into energy and CO2.

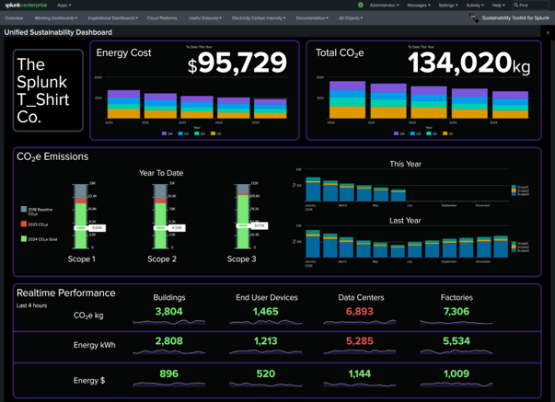
The Splunk Sustainability Toolkit shows in real time where and when activities should be carried out to minimize energy costs and the associated CO2 emissions.
-
Show trends in CO2 emissions over time, broken down by buildings, data center or production
-
Identify issues (e.g., emission hotspots or a significant increase in water consumption) to preemptively troubleshoot and meet your goals
-
Digitize your data collection for CSRD reporting to improve accuracy and efficiency
-
Visualize progress towards your organization's goals in real-time with trend analysis dashboards and custom executive views
Includes easy-to-create visualizations, reports, and reference works
Consist is Sustainability Partner of the Year 2025_Germany for Cisco, which acquired Splunk in March 2024.

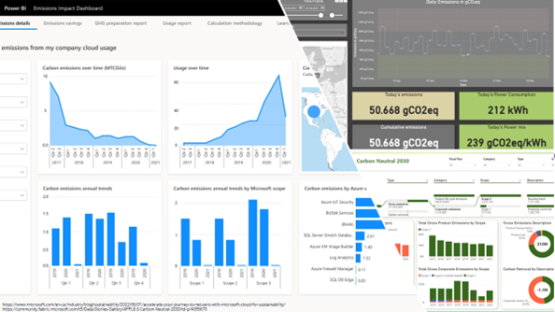
Data Science and Power BI
Our data science solutions enable you to analyze data from additional sources and thus gain a complete insight for your sustainability report:
- Data Engineering: create and prepare a complete and standardized basis for all your individual sustainability reporting (e.g. CO2 emissions, electricity consumption, etc.) – in the cloud or on premise.
- Big Data Analytics: Link and analyze your data of any size and enable detailed insights into e.g. temporal trends or dependencies – in real time or on a fixed schedule.
- Artificial Intelligence: Use state-of-the-art artificial intelligence methods to uncover trends or patterns in your data and identify unrecognized correlations.
- Attractive visualizations: Analyze and visualize your data through intuitive and interactive dashboards for your reports – tailored to your individual needs.
Gain detailed insights and fulfil reporting obligations
Companies must submit sustainability report
From January 1, 2024, larger companies, and successively smaller ones, will have to implement the new EU Corporate Sustainability Reporting Directive (CSRD).
The focus here is on the so-called scopes - emission categories for greenhouse gases that companies emit in different areas. Together, these result in a company's greenhouse gas balance and thus its carbon footprint. To make this measurable, companies must report the greenhouse gas emissions of Scopes 1, 2 and 3. Data plays a key role in this.
With appropriate data collection and analysis, comprehensive energy and cost management including reporting becomes possible.

Your contact

Sophie Dockstader
Sustainability Portfolio Lead
phone: +49 431 3993-533
mobile: +49 1523 3993530
e-mail: dockstader@consist.de


Sustainable and innovative solutions are our passion.
Sophie Dockstader
Sustainability Portfolio Lead
Consist